Explain the methods, show your working and interpret results in context.
Foundation shows shared notes and questions. Higher includes the labelled extensions. Maps and checklist downloads include labelled Higher content; the worksheet generator filters individual goals.
Revise the key ideas
Population estimation
Estimate a proportion — If 36 of 120 sampled pupils cycle, estimate the population cycling proportion as 0.3. In a population of 800 this predicts about 240 cyclists. The estimate depends on representative selection, accurate responses and an appropriate date; it is not an exact census total.
Estimate centre — Use a representative sample mean to estimate a population mean. Approximately half a comparable population may lie above the sample median, but ties and sampling variation affect this statement. An estimate summarises a population characteristic, not each individual's value.
Size and replication — Larger random samples generally give less variable estimates; repeating comparable samples reveals variability. Independent repetitions should use consistent methods. A large biased sample can still give a consistently wrong answer; improving coverage and reducing bias matter alongside sample size.
State limitations — Distinguish an estimate from a certainty, explain the source and method and identify likely error or bias. If a sample covers only one shift, extend the frame to other shifts before generalising about all production. Give specific improvements related to the actual weakness.
Higher — capture–recapture
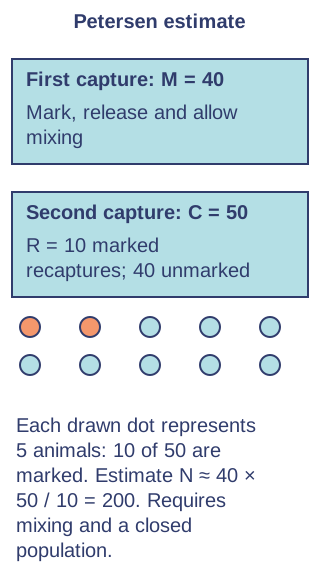
Petersen estimate — Capture and mark M individuals, release and allow them to mix, then capture C individuals and count R marked recaptures. Estimate population N ≈ MC/R. With M=40, C=50 and R=10, estimate N=200; use total second catch, not just unmarked individuals.
Capture assumptions — Assume a closed population, retained recognisable marks, mixing and comparable capture probabilities. Marking must not change survival or capture behaviour. If marked animals become easier to catch, R can be too large and N underestimated; immigration can invalidate the closed-population assumption.
Small recaptures — A small R makes the estimate unstable because a change of one recapture changes the denominator substantially. R=0 gives no finite estimate from this formula; use a revised sampling plan rather than inventing a total. Ethical animal methods need expert oversight.
Higher — quality assurance
Sample summaries — Means from repeated comparable samples usually vary less than individual observations from the same population because averaging balances high and low values. Use the distribution of the monitored sample statistic, not the SD of individual items, when setting its limits.
Control charts — Plot a sample mean, median or range against sample number/time, with a target and warning/action lines. Keep sample size and method consistent. A control chart checks process behaviour; specification limits for individual products serve a different purpose.
Warning and action limits — In the stated mean-chart model warning lines are target ±2 SD of sample means and action lines target ±3 SD of sample means. About 1 in 20 fall outside warning lines and almost all lie inside action lines under the approximate normal model. Random variation can occasionally produce a warning.Sample-mean control limits. Original illustrative diagram; numerical datasets are fictional worked examples.Enlarge diagram
Respond to evidence — An observation outside action limits calls for stopping/investigating the process and correcting an identified cause. Between warning and action lines, take another sample and investigate repeated warning signals under the stated procedure. Within limits normally continue monitoring, while watching patterns rather than assuming permanent perfection.
Test yourself
30 questions · Sets of 10 from the selected tier. For fractions, use / when typing; for powers, use superscripts or ^. Follow each question's answer format. These quick checks support revision; practise full written solutions, graph constructions and enquiries too.
Mind map
Use the branches to recall the ideas and explain their connections. Check the revision notes for the full detail.
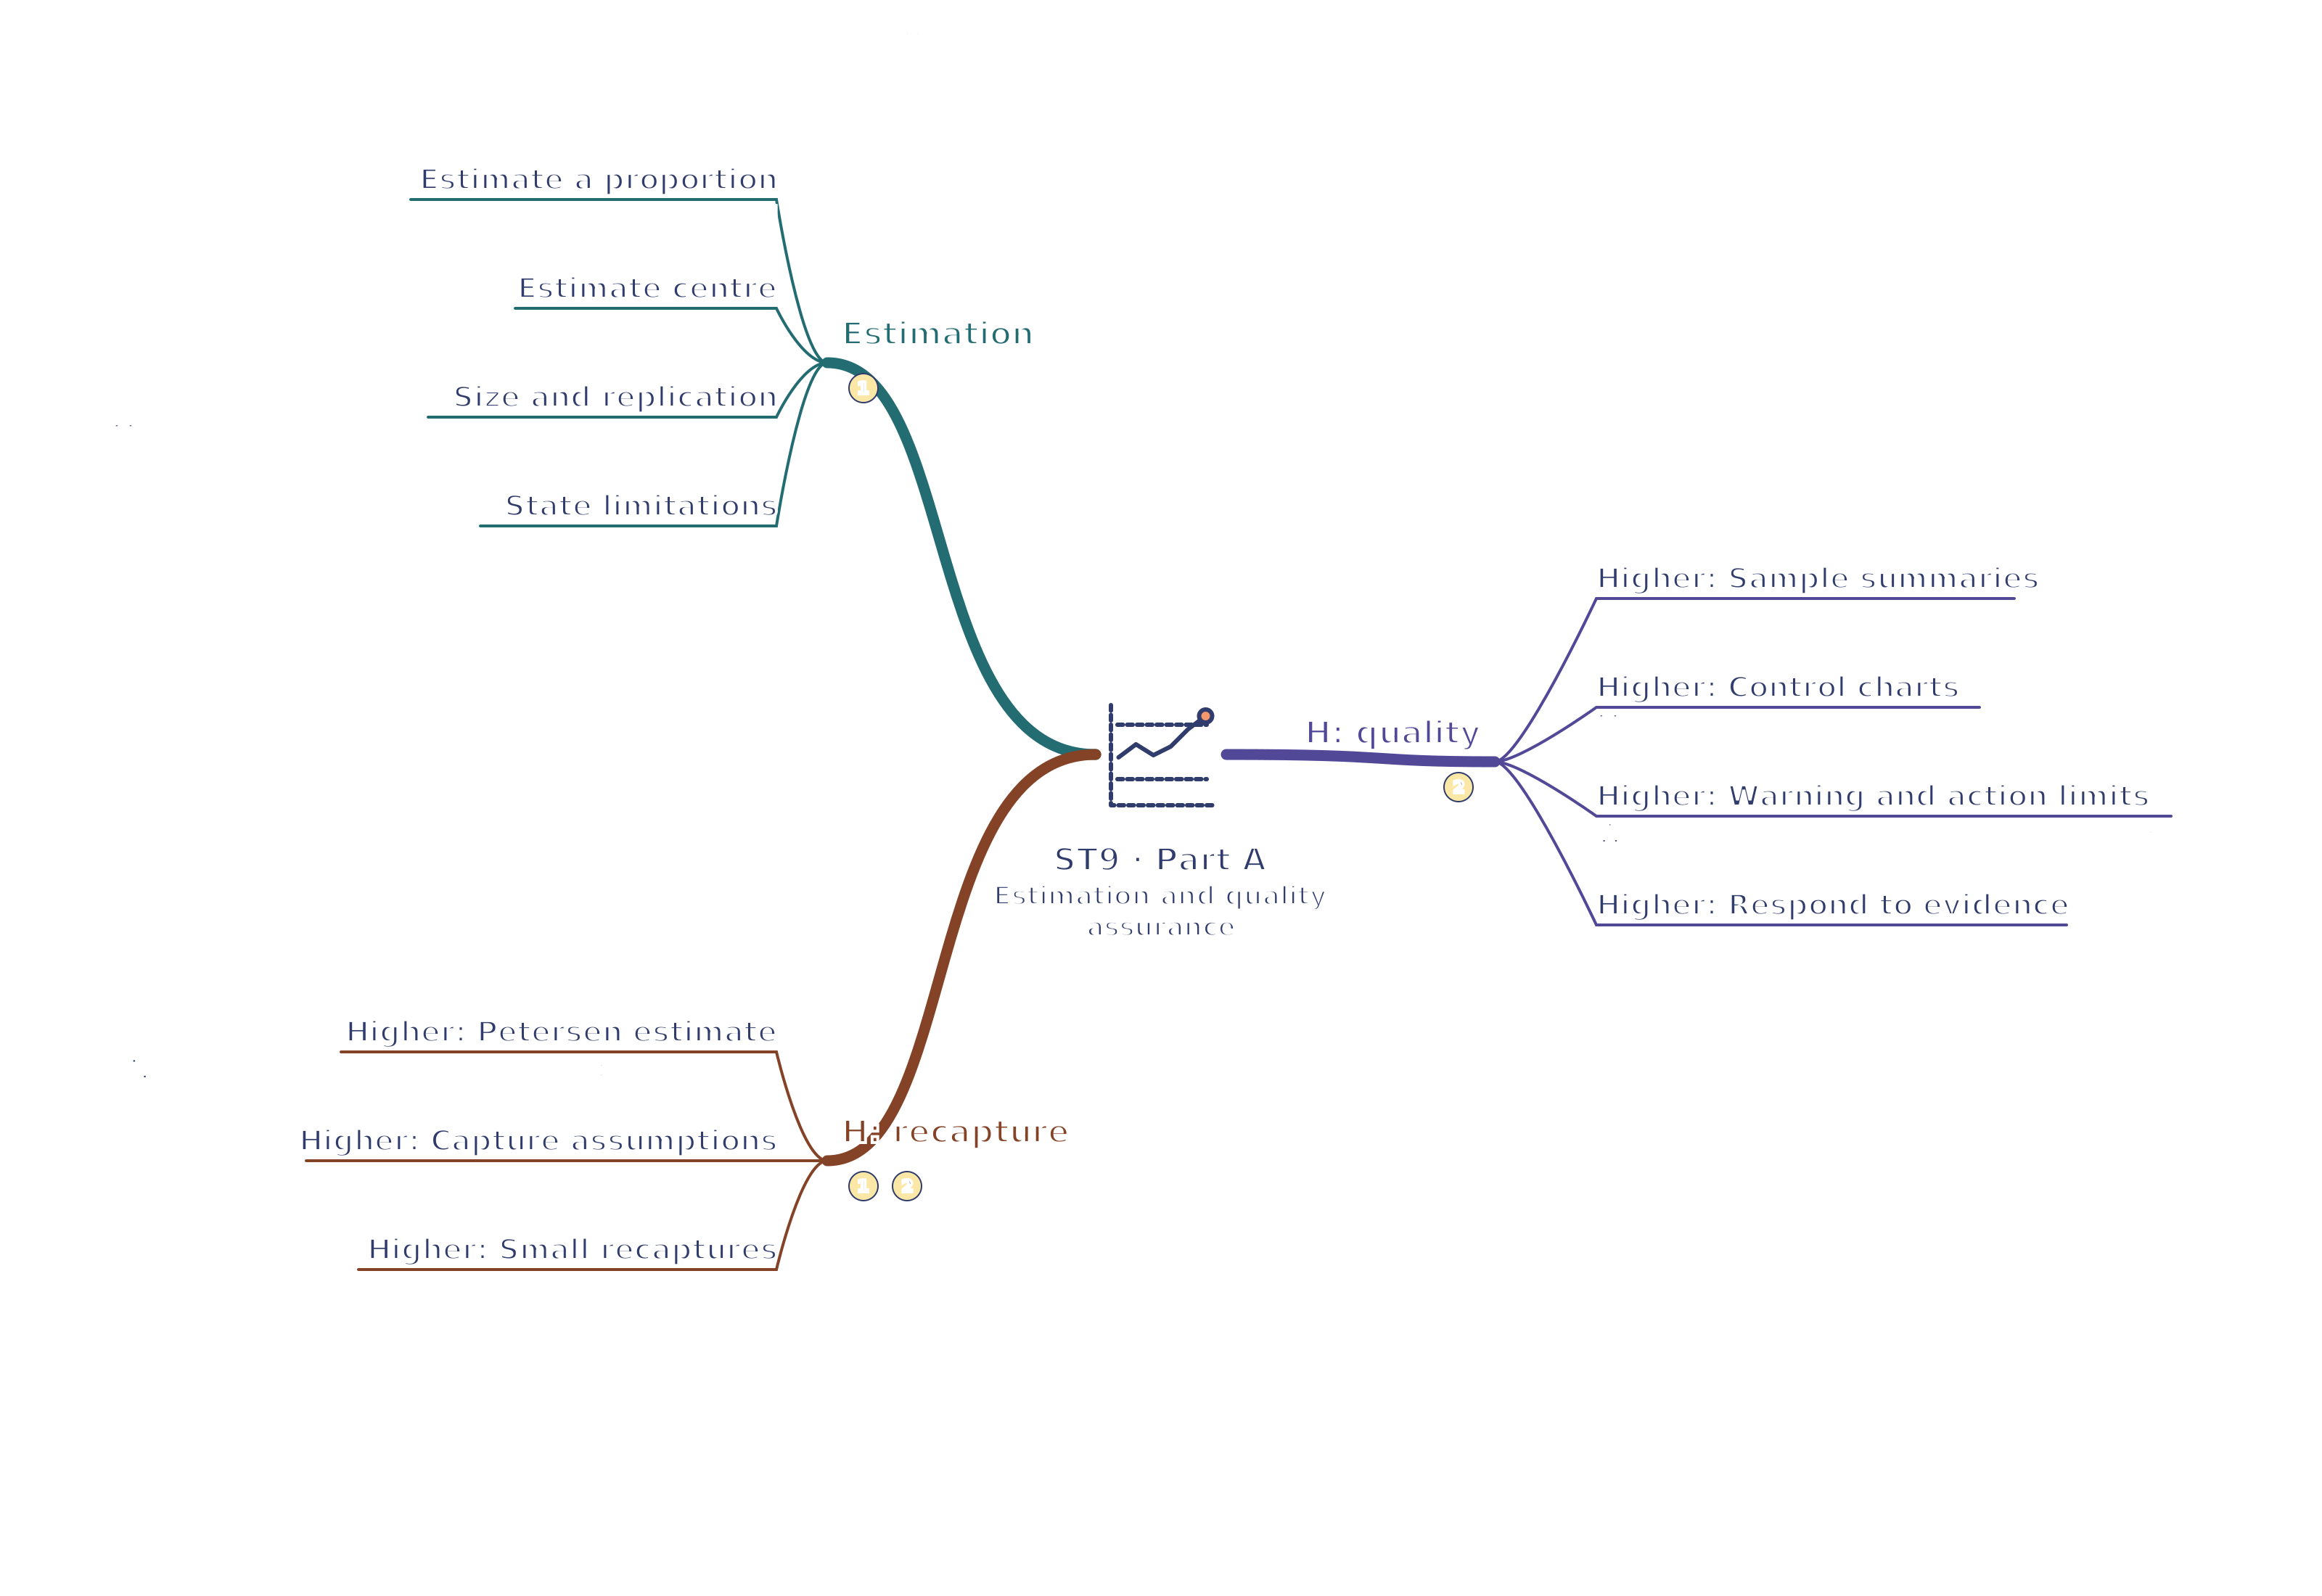
ST9 · Estimation / H: recapture / H: quality
View ST9 · Estimation / H: recapture / H: quality mind mapOpen the full-size map to zoom. Download the PDF to print on A4 or enlarge to A3.
 Mr Kidman's Classroom