Explain the methods, show your working and interpret results in context.
Foundation shows shared notes and questions. Higher includes the labelled extensions. Maps and checklist downloads include labelled Higher content; the worksheet generator filters individual goals.
Revise the key ideas
Population and samples
Population and frame — The population is the complete group about which a conclusion is wanted; it can be people, products or measurements. A sampling frame lists or identifies eligible members. A school register misses pupils absent from its coverage if the target is all local children.
Census or sample — A census attempts every member; a sample uses a subset. A census may be costly or impossible, especially with destructive testing. A representative sample saves resources but introduces sampling variation; even a census can suffer missing responses and measurement error.
Simple random selection — Number a complete frame, use unbiased random numbers and reject out-of-range numbers and repeats when selecting distinct members. In simple random sampling each possible sample of the chosen size is equally likely; avoid selecting only names that are easy to contact.
Systematic sampling — With N = 200 and n = 20, select every tenth record after an appropriate start. It is simple to administer but a repeating pattern in the list can coincide with the interval and distort the sample. It is not generally a simple random sample.
Quota and convenience — Quota sampling fills target category totals using non-random choices; opportunity sampling takes accessible members; judgement sampling deliberately selects useful cases. They can be quick or practical but personal selection can cause bias. Meeting quotas alone does not make selection random.
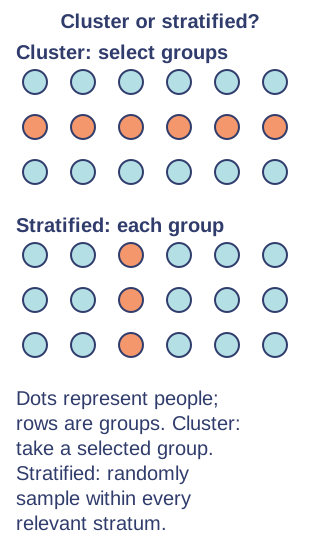
Cluster sampling — Select groups such as streets or classes and study members within the selected groups. Travel and administration may be cheaper, but similar people within a cluster can reduce effective diversity; few chosen clusters may poorly represent the whole population.
Stratification — Split the population into non-overlapping relevant strata and sample within every stratum, ideally randomly. Allocate n × stratum size / population size. From 300 pupils, 120 in Year 10, a sample of 50 requires 20 from Year 10; resolve rounding so allocations total 50.A proportional stratified sample. Original illustrative diagram; numerical datasets are fictional worked examples.Enlarge diagram
Non-response and size — A larger well-designed sample usually reduces random variation, but cannot cure a biased frame or systematic non-response. Record response rates, investigate missing groups and follow up appropriately. Avoid replacing all non-responders with whichever friends are available.
Collection and cleaning
Collection methods — Questionnaires and interviews collect reports; observation records behaviour; experiments change conditions; natural experiments use existing changes; simulations model outcomes. Choose a method that measures the variable ethically and realistically. A census is a coverage approach rather than a guarantee of quality.
Recording sheets — Give each observation an identifier and columns for variables, units, time and relevant conditions. Use a consistent definition and measurement precision. Separate zero from missing, and retain enough information to check apparent anomalies against the source.
Question wording — Ask neutral questions with a clear time period. Avoid leading or double questions such as how excellent and cheap was it. Closed choices need exhaustive, non-overlapping options, including an appropriate other or non-response choice; open questions give richer answers but are harder to code.
Interviews and pilots — Interviewers can clarify questions but their presence or tone can change answers. A pilot tests wording, response categories and timing on a small group before the main questionnaire; a pre-test checks experimental procedures and equipment. Revise problems rather than treating pilot data as automatically representative.
Reliability and validity — Reliability concerns consistency when repeated under comparable conditions; validity concerns measuring what was intended. A faulty scale that always adds 2 kg can be reliable while invalid. Repeat measurements, calibrate tools and check that a chosen proxy represents the actual concept.
Sensitivity and bias — Sensitive questions can invite refusals or socially desirable answers. Confidential collection, neutral language and voluntary participation may reduce distortion. Record the possible direction of bias and avoid claiming anonymity when identifiable records are actually retained.
Clean without inventing — Check duplicates, impossible values, mixed units, missing entries and formats before analysis. Remove currency symbols from numeric spreadsheet cells only with a consistent conversion. Consult source records to correct errors; do not silently replace missing values with zero or delete genuine unusual cases.
Extraneous variables — An extraneous variable can influence the response alongside the investigated variable. Keep relevant conditions comparable or record them for evaluation, such as prior experience when comparing training methods. Uncontrolled differences can offer an alternative explanation for the observed association.
Higher — designs and sensitive responses
Multiple strata — Stratify on more than one category by forming combinations, such as year group and travel mode. Use each combination's population count for allocation; sampling only by year may leave a small travel group unrepresented. Avoid cells too small for the planned sample.
Random response — A private random instruction can tell a participant either to answer truthfully or give a forced response. The researcher estimates the group proportion from the known random mechanism without identifying each person's truthful answer. If half answer truthfully and half say yes, observed yes rate = 0.5p + 0.5.
Controls and matched pairs — A control group provides a comparison under a baseline condition. Matched pairs compare similar individuals, or the same person under two conditions, to reduce variation from relevant characteristics. Random allocation and order control help; matching cannot remove every unmeasured influence.
Test yourself
30 questions · Sets of 10 from the selected tier. For fractions, use / when typing; for powers, use superscripts or ^. Follow each question's answer format. These quick checks support revision; practise full written solutions, graph constructions and enquiries too.
Mind map
Use the branches to recall the ideas and explain their connections. Check the revision notes for the full detail.
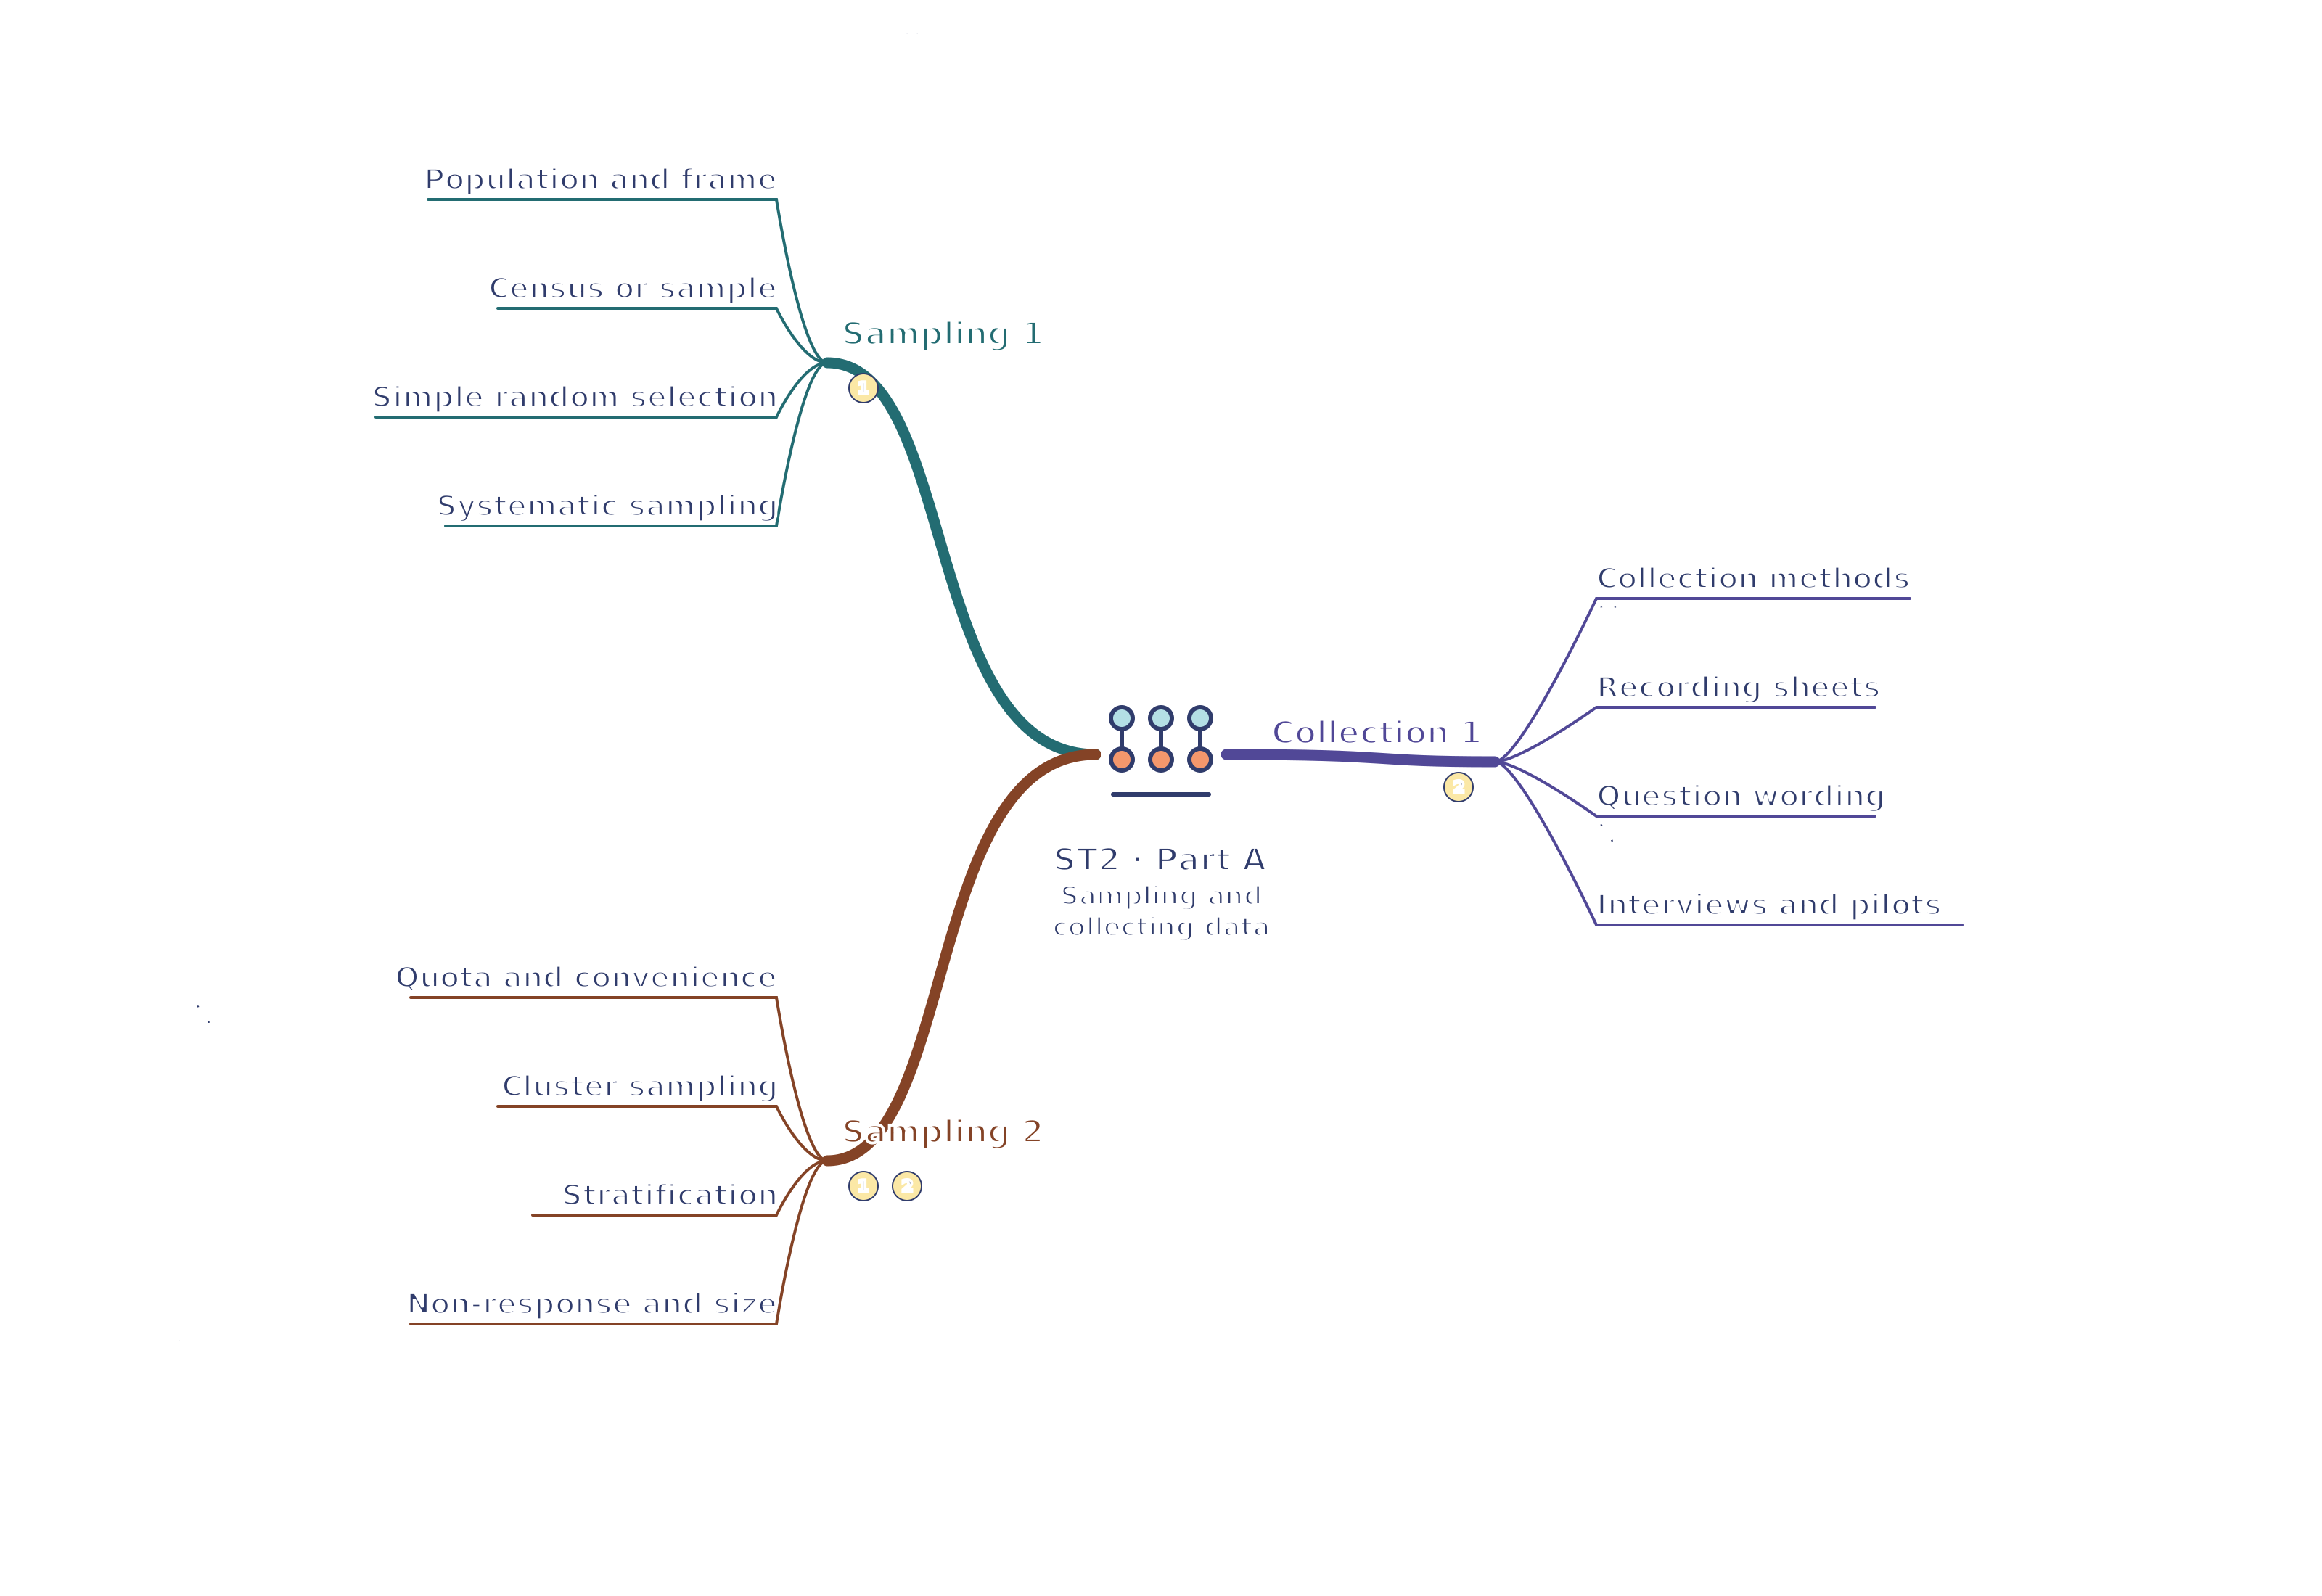
ST2 · Sampling 1 / Sampling 2 / Collection 1
View ST2 · Sampling 1 / Sampling 2 / Collection 1 mind mapOpen the full-size map to zoom. Download the PDF to print on A4 or enlarge to A3.
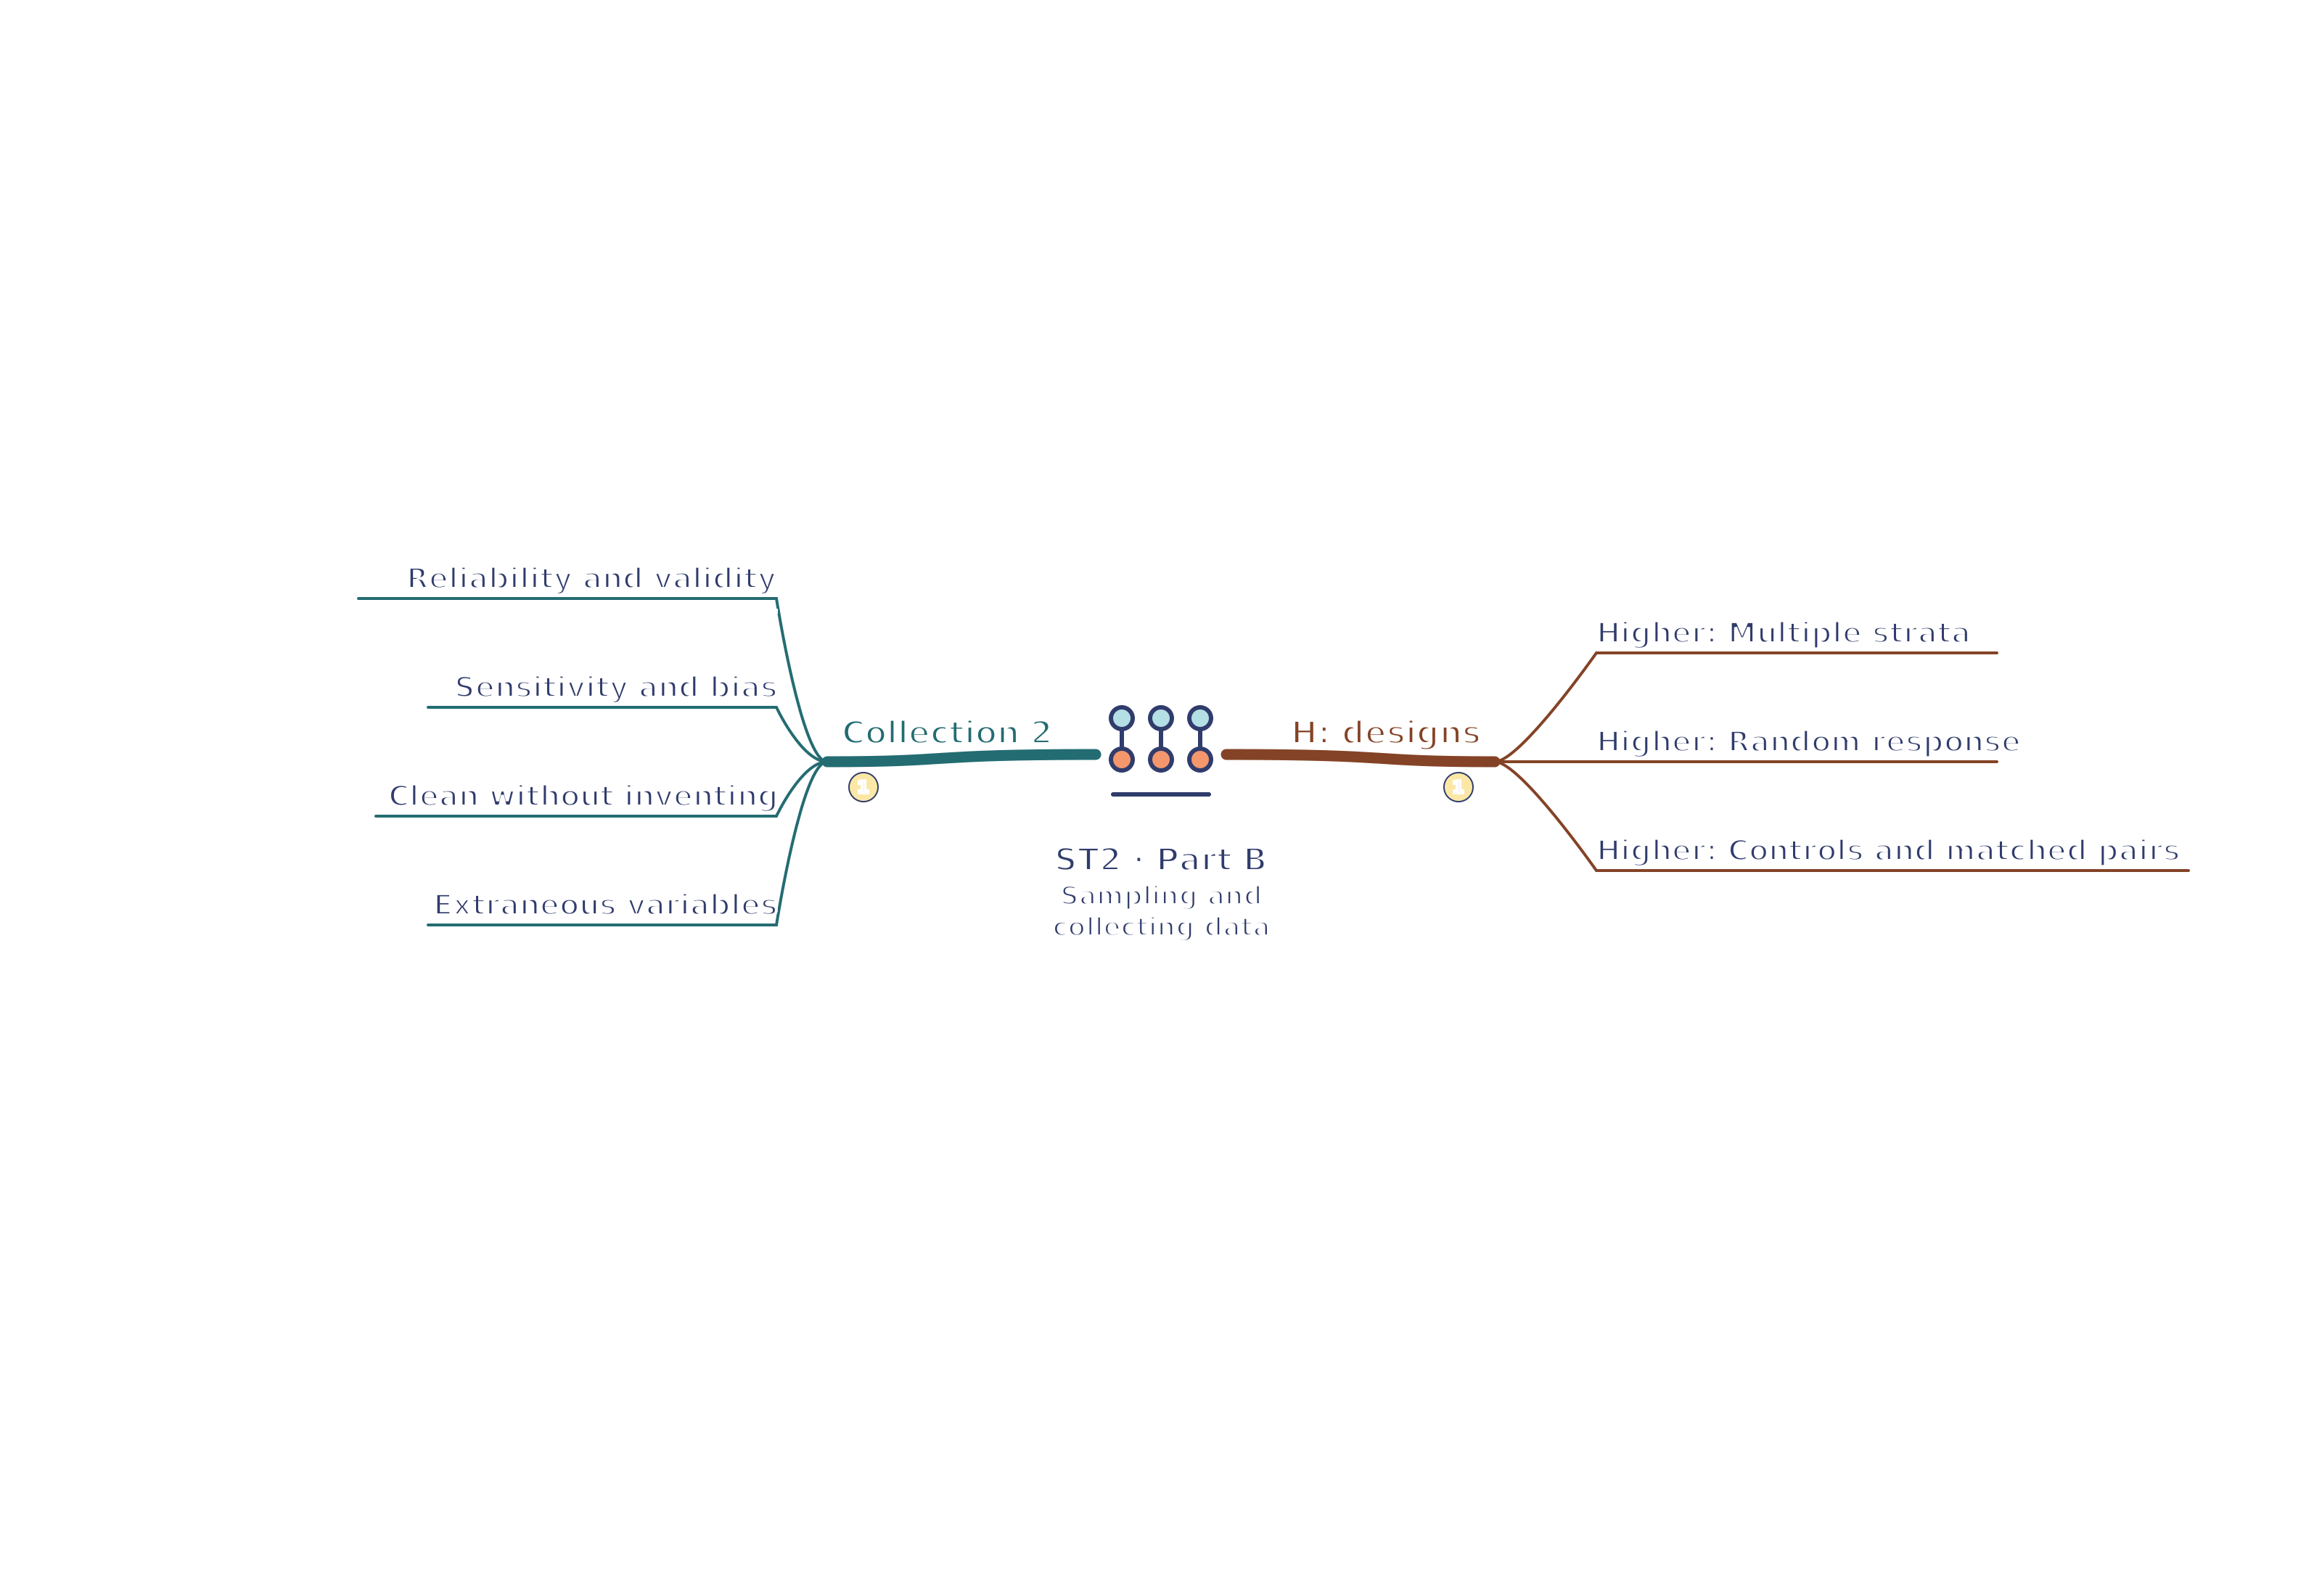
Higher: Random response: Known random mechanism protects sensitive answers.
Higher: Controls and matched pairs: Baseline and matching reduce alternative explanations.
Connections
Sampling 1 → Sampling 2: The frame and selection methods determine whether strata and other population groups are represented.
Sampling 2 → Collection 1: Selection and non-response risks must inform collection methods, recording and pilots.
Part connections
ST2 · Sampling 1 / Sampling 2 / Collection 1: Sampling 1 → Sampling 2 — The frame and selection methods determine whether strata and other population groups are represented.
ST2 · Sampling 1 / Sampling 2 / Collection 1: Sampling 2 → Collection 1 — Selection and non-response risks must inform collection methods, recording and pilots.
 Mr Kidman's Classroom