Explain the methods, show your working and interpret results in context.
Foundation shows shared notes and questions. Higher includes the labelled extensions. Maps and checklist downloads include labelled Higher content; the worksheet generator filters individual goals.
Revise the key ideas
Enquiry cycle
Question and hypothesis — Start with a question about a defined population and measurable variables. A hypothesis predicts a relationship that appropriate data can support or challenge; a personal opinion alone cannot test it. For example, investigate whether older bicycles tend to sell for less.
Plan before collecting — Decide the source, sample, recording method, diagrams and calculations before gathering observations. Explain why each choice answers the question. A plan that collects only favourite colours cannot test a claim about journey duration.
Constraints and safeguards — Time, cost, access, sensitive information and confidentiality can restrict a study. Use informed participation, collect only necessary information, anonymise records and secure them. Plan alternative sources and follow-up for non-response before difficulties arise.
Process and represent — Clean records, organise tables, draw appropriate graphs and calculate suitable summaries. A spreadsheet automates arithmetic but cannot decide whether a sample or chart is suitable; check formulas, ranges, labels and outputs yourself.
Interpret in context — Explain what the evidence suggests about the original hypothesis, with numbers, units and qualifications. Describe uncertainty, unusual observations and the population to which the result can reasonably apply; a sample result is not a universal proof.
Evaluate and refine — Identify limitations, explain their likely effect and propose a specific improvement. Communicate for the intended audience with labelled displays and concise conclusions. Retest or refine the question when evidence reveals a weakness: the cycle is iterative.An iterative statistical enquiry. Original illustrative diagram; numerical datasets are fictional worked examples.Enlarge diagram
Authentic enquiry — For a full investigation choose a real sourced dataset or ethical primary collection with your teacher. Record the source, date, population and methods. Worked examples here illustrate techniques; they do not represent your own collected evidence.
Data and variables
Qualitative and ordinal — Qualitative data describe categories, such as travel mode. Ordinal categories have a meaningful order, such as poor, fair and good, but equal gaps are not implied. Assigning category codes 1, 2 and 3 does not make their differences measured quantities.
Discrete and continuous — Quantitative data are numerical. Discrete data have separate possible values, such as a count of customers; continuous data are measurements, such as mass, that can take any value in an interval. Rounding a mass to whole grams does not change the underlying variable to discrete.
Raw and grouped — Raw data are individual recorded values. Grouping values into classes makes patterns easier to see but loses exact observations. Use non-overlapping classes covering the possible range: 10 ≤ x < 20 includes 10 but excludes 20; its width is 10.
Bivariate roles — Bivariate data record two variables for the same item, such as age and sale price for each bicycle. Put the explanatory variable on the horizontal x-axis and response on the vertical y-axis. Their roles express the investigation, not automatic proof of causation.
Primary and secondary — Primary data are collected for the current investigation; secondary data were already collected for another purpose. Primary collection can fit the question but costs time. Secondary data can be extensive but may use different definitions, dates, sampling or precision; acknowledge the source.
Merging categories — Combining rare travel modes as other simplifies a display but hides distinctions. Preserve relevant categories for the hypothesis, explain regrouping and check that totals are unchanged. Use original data when an exact value is needed rather than reverse-engineering a grouped estimate.
Higher — multivariate data
Several variables — Multivariate records contain more than two variables for each item, such as age, price, condition and brand of a bicycle. Extra variables can help explore confounding explanations; inspecting pairwise plots still does not establish a causal effect.
Test yourself
30 questions · Sets of 10 from the selected tier. For fractions, use / when typing; for powers, use superscripts or ^. Follow each question's answer format. These quick checks support revision; practise full written solutions, graph constructions and enquiries too.
Mind map
Use the branches to recall the ideas and explain their connections. Check the revision notes for the full detail.
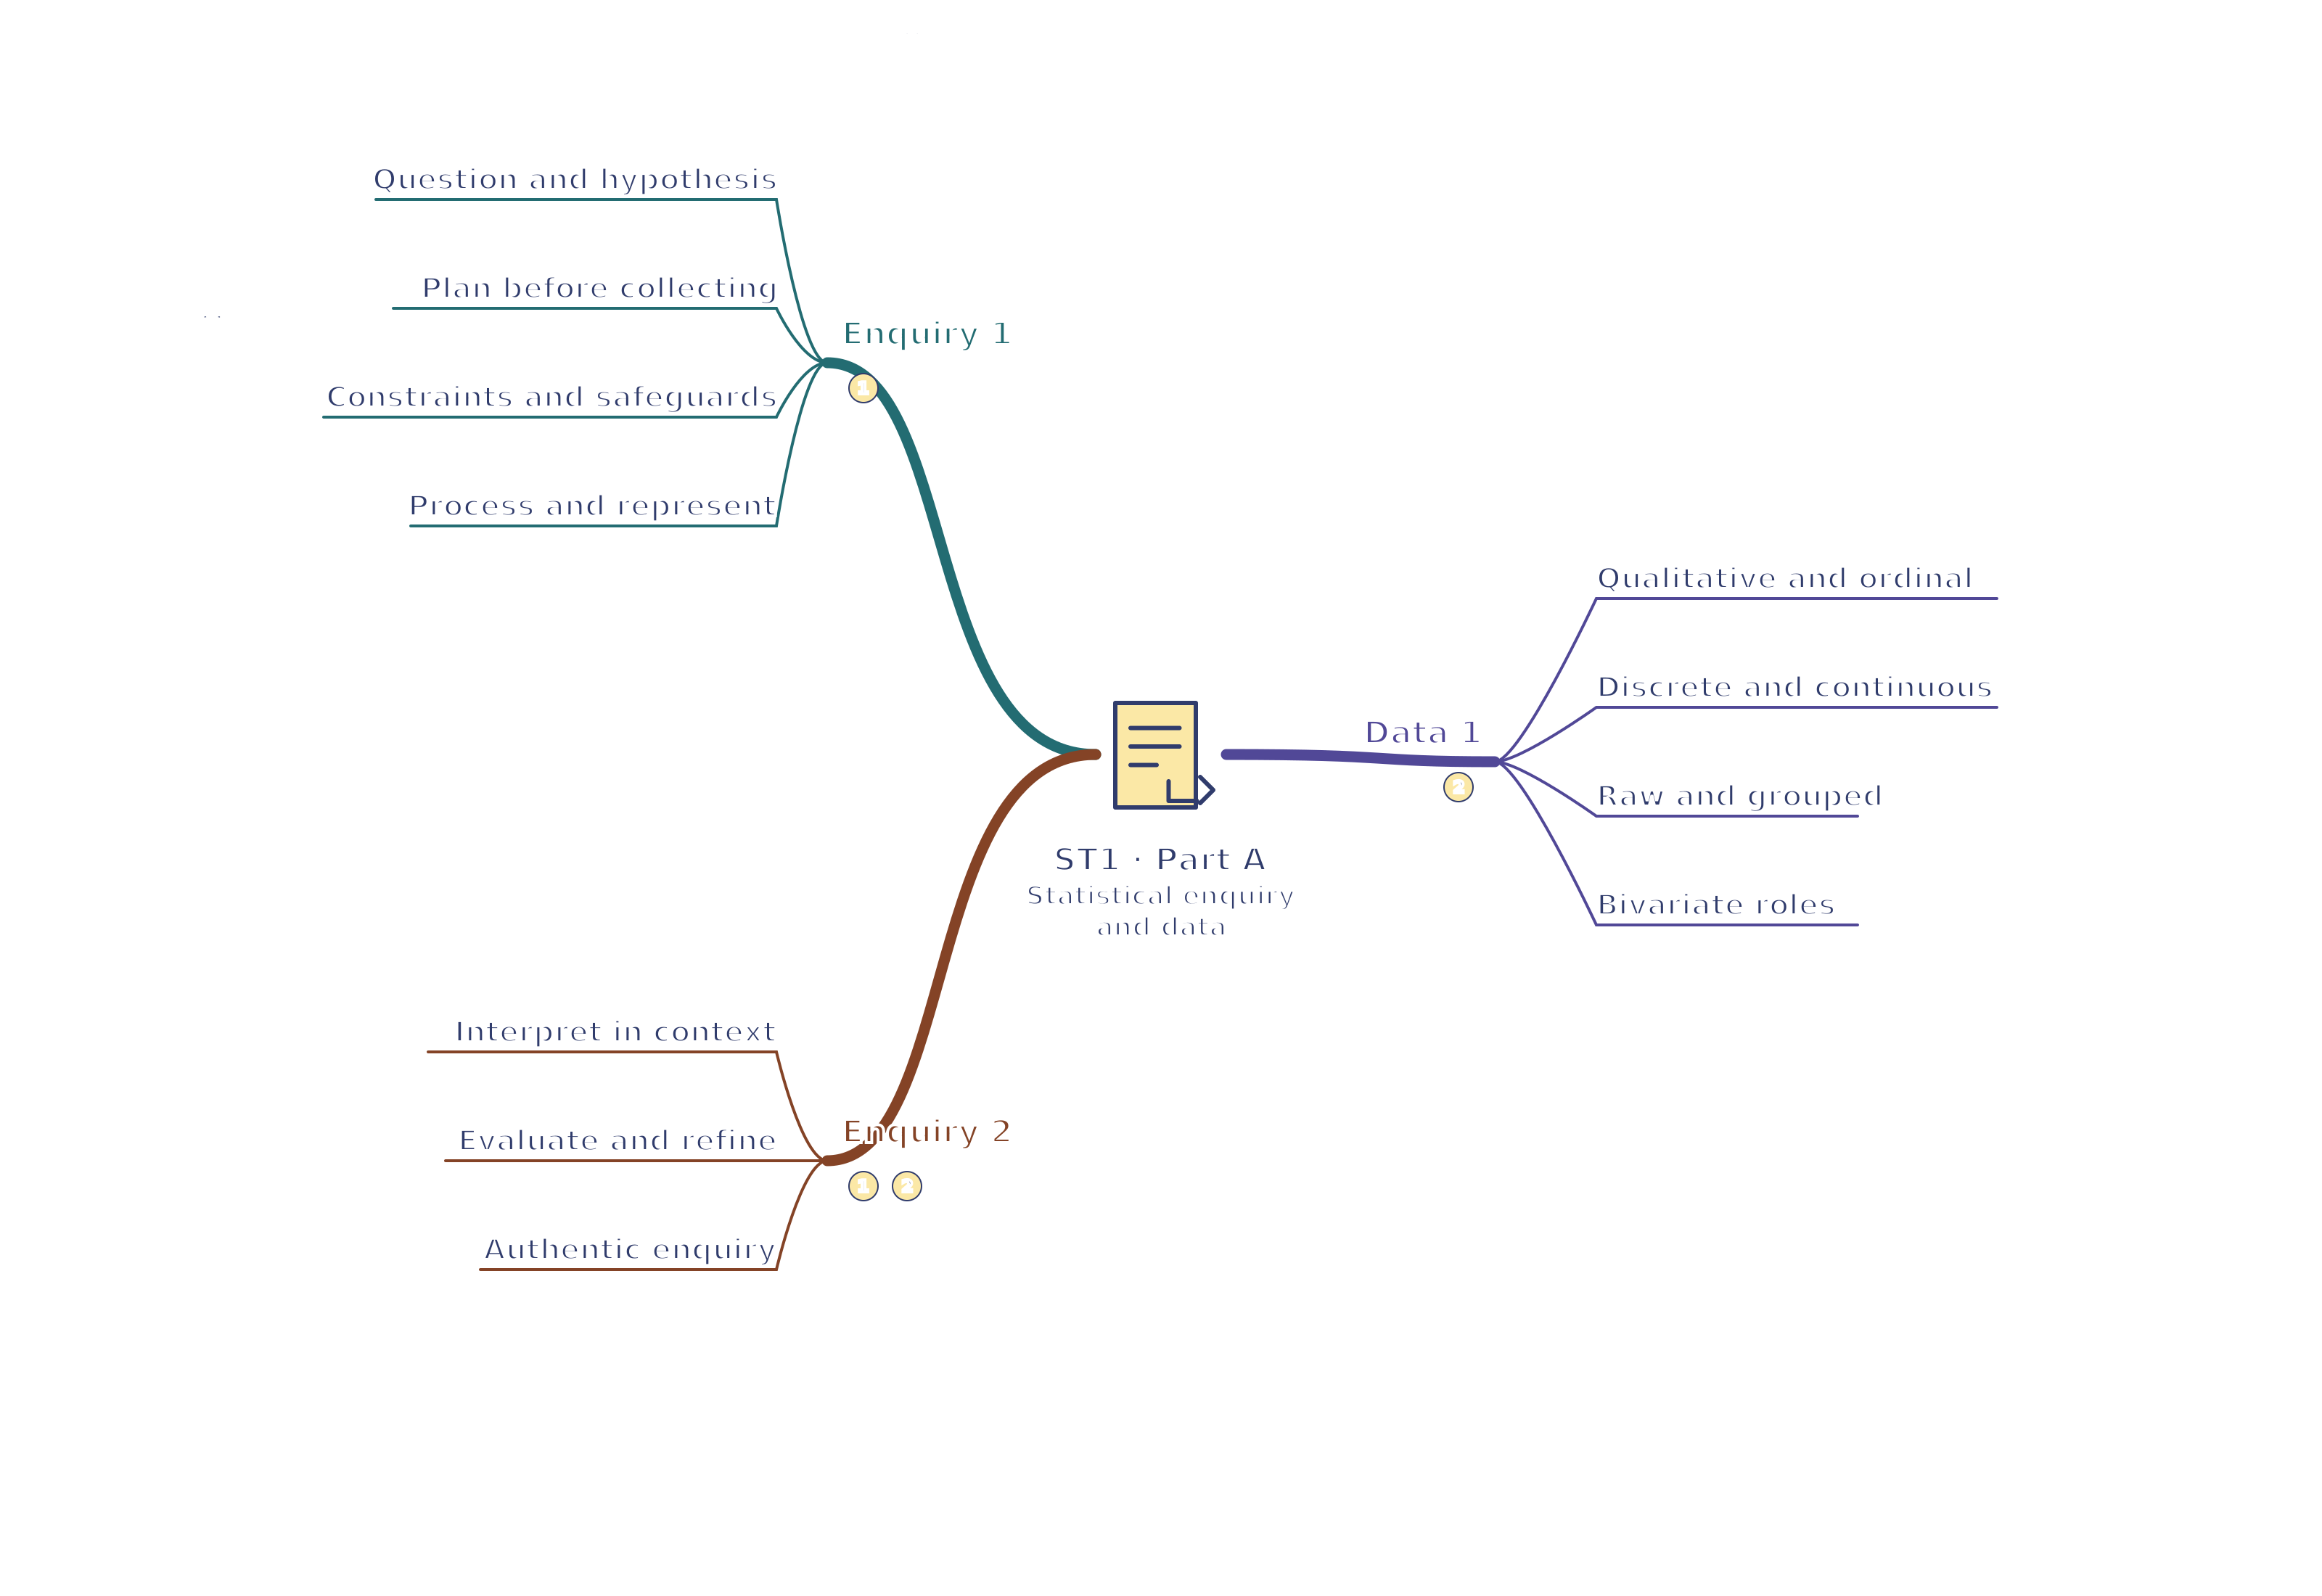
ST1 · Enquiry 1 / Enquiry 2 / Data 1
View ST1 · Enquiry 1 / Enquiry 2 / Data 1 mind mapOpen the full-size map to zoom. Download the PDF to print on A4 or enlarge to A3.
Question and hypothesis: Define population and measurable hypothesis.
Plan before collecting: Match collection and analysis to question.
Constraints and safeguards: Plan time, cost, access and confidentiality.
Process and represent: Clean, organise, visualise and calculate.
Enquiry 2
Interpret in context: Link evidence back to the hypothesis.
Evaluate and refine: Evaluate weaknesses and refine enquiry.
Authentic enquiry: Use real evidence for a complete enquiry.
Data 1
Qualitative and ordinal: Categories may have order without equal gaps.
Discrete and continuous: Counts discrete; measurements continuous.
Raw and grouped: Grouping trades detail for clarity.
Bivariate roles: Pair observations; explanatory x, response y.
Data 2
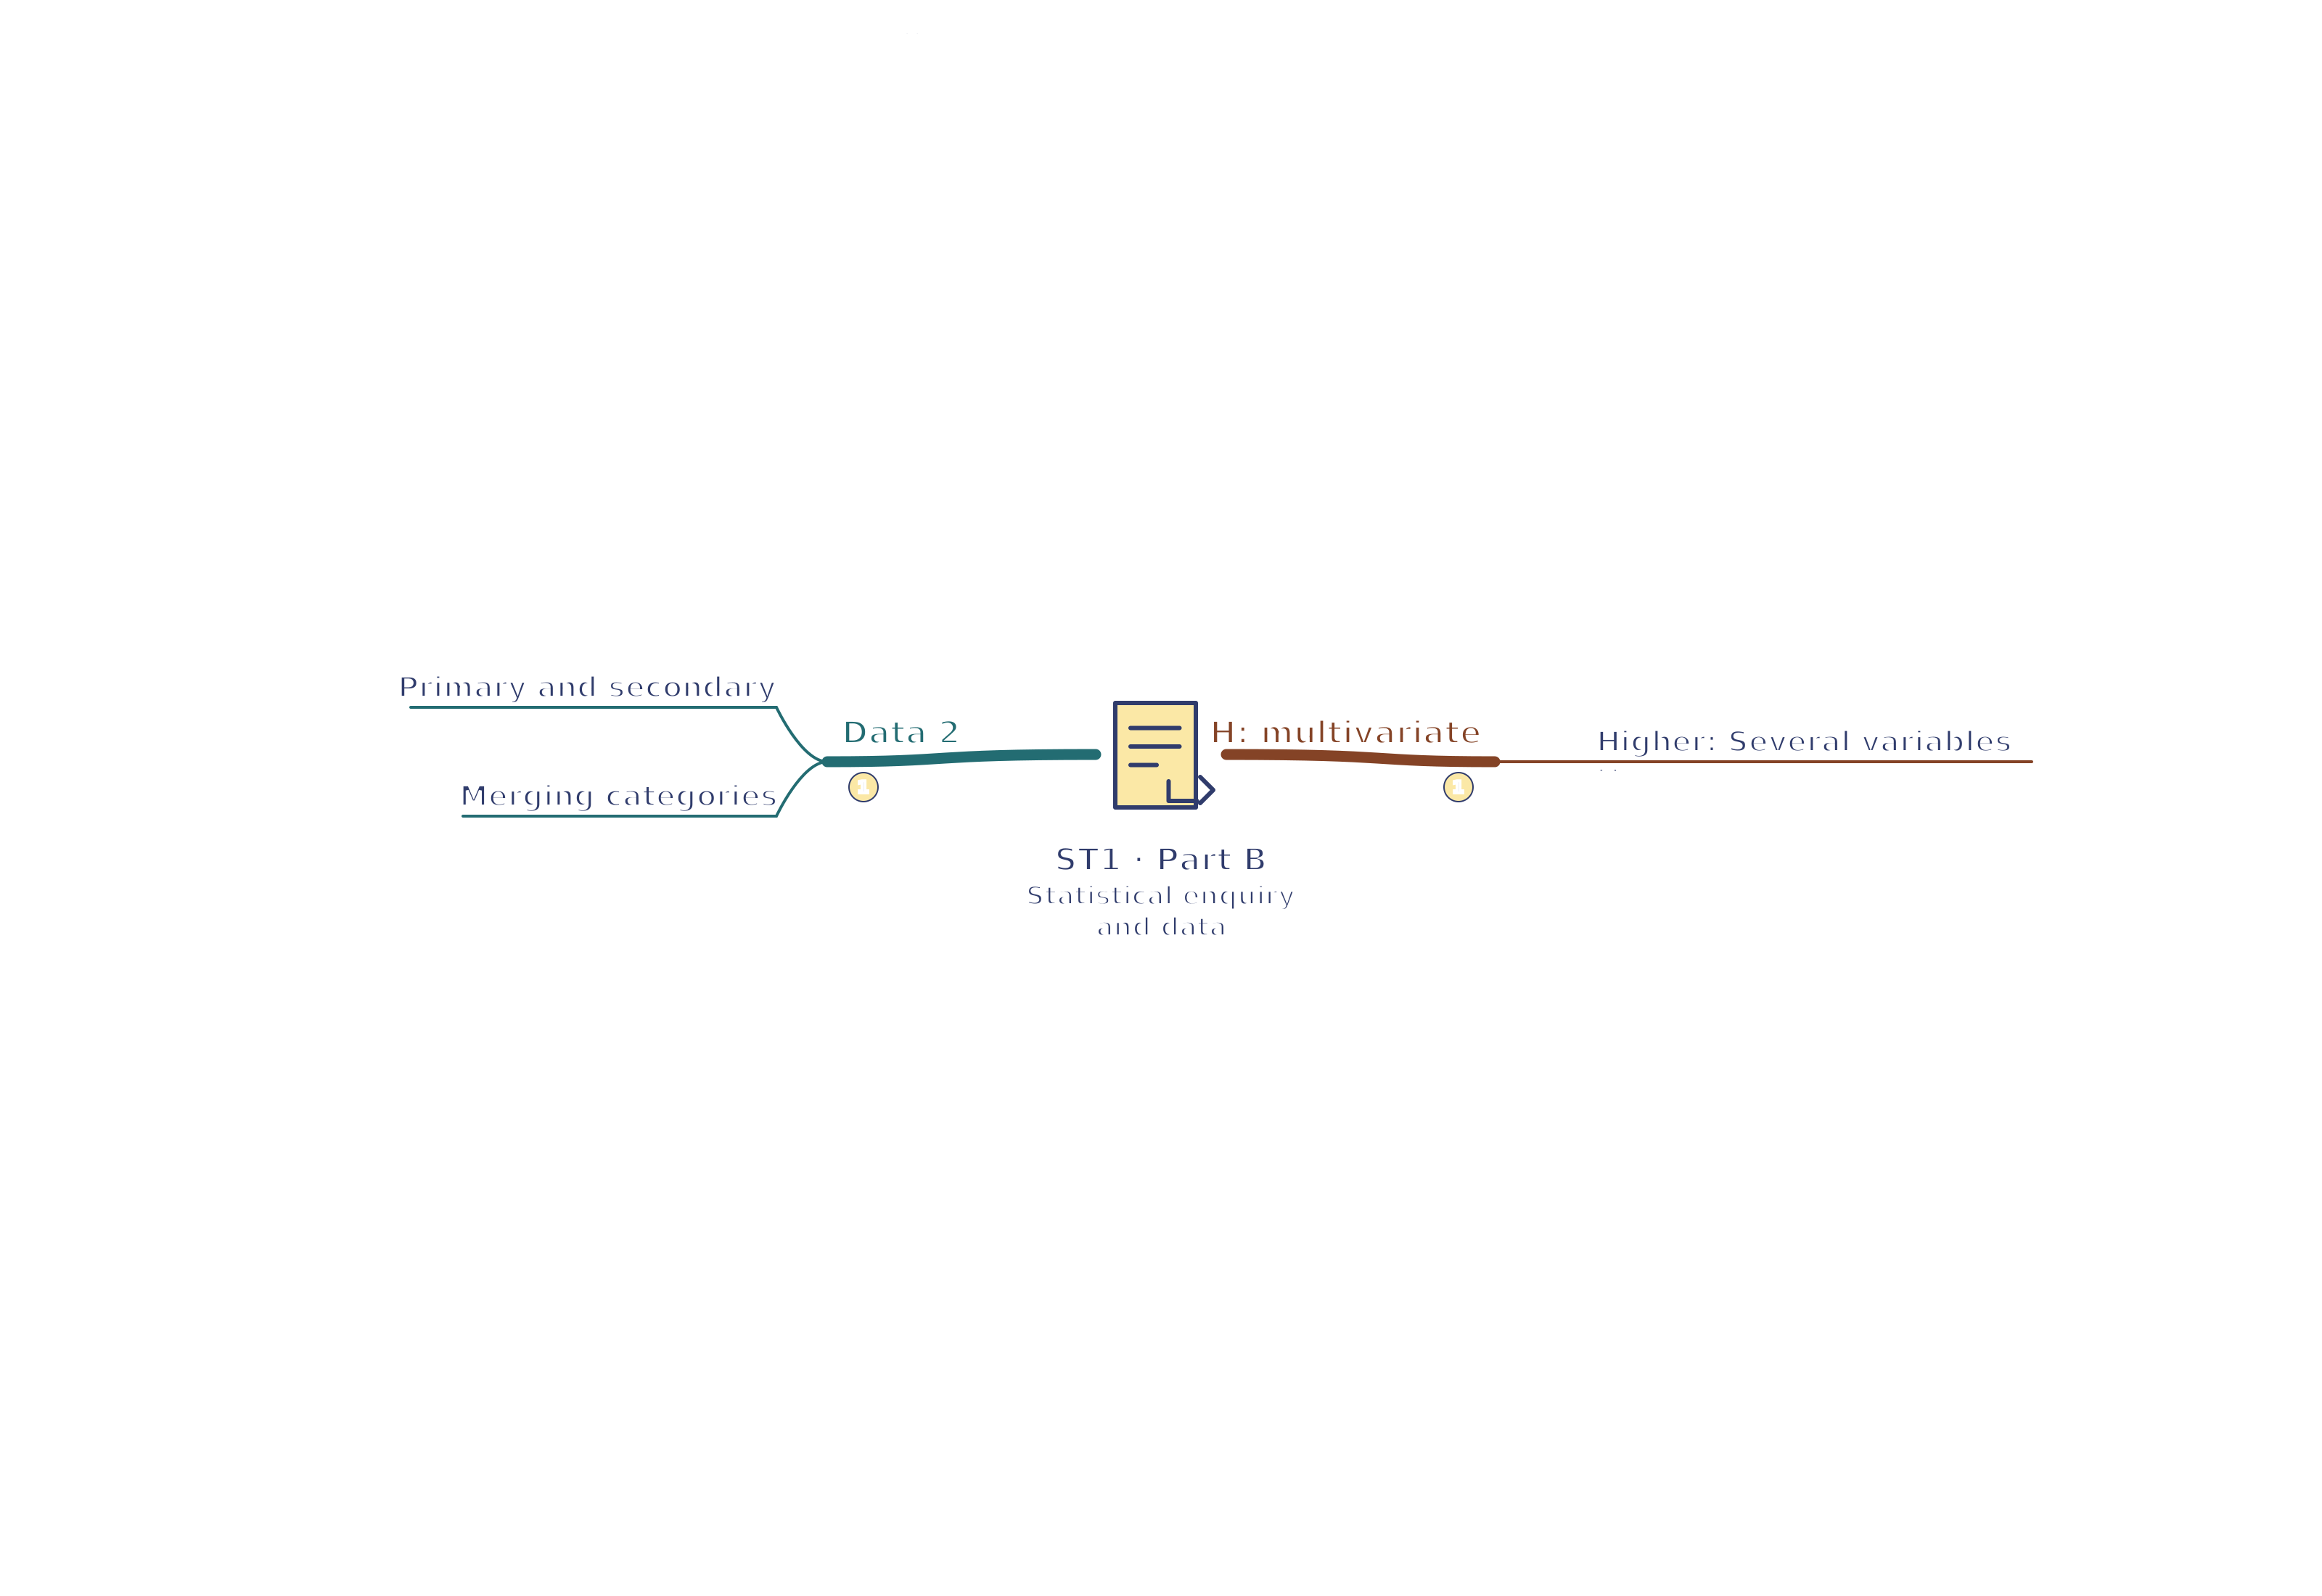
Primary and secondary: Evaluate fitness and provenance of sources.
Merging categories: Regroup only with a justified loss of detail.
H: multivariate
Higher: Several variables: Multiple variables can reveal confounding.
Connections
Enquiry 1 → Enquiry 2: A defined hypothesis and suitable collection plan support qualified interpretation and refinement.
Enquiry 2 → Data 1: Interpretation must respect what each recorded variable measures and what grouping has hidden.
Part connections
ST1 · Enquiry 1 / Enquiry 2 / Data 1: Enquiry 1 → Enquiry 2 — A defined hypothesis and suitable collection plan support qualified interpretation and refinement.
ST1 · Enquiry 1 / Enquiry 2 / Data 1: Enquiry 2 → Data 1 — Interpretation must respect what each recorded variable measures and what grouping has hidden.
ST1 · Data 2 / H: multivariate: Data 2 → H: multivariate — Source choice and category merging affect the information retained in multivariate records.
 Mr Kidman's Classroom