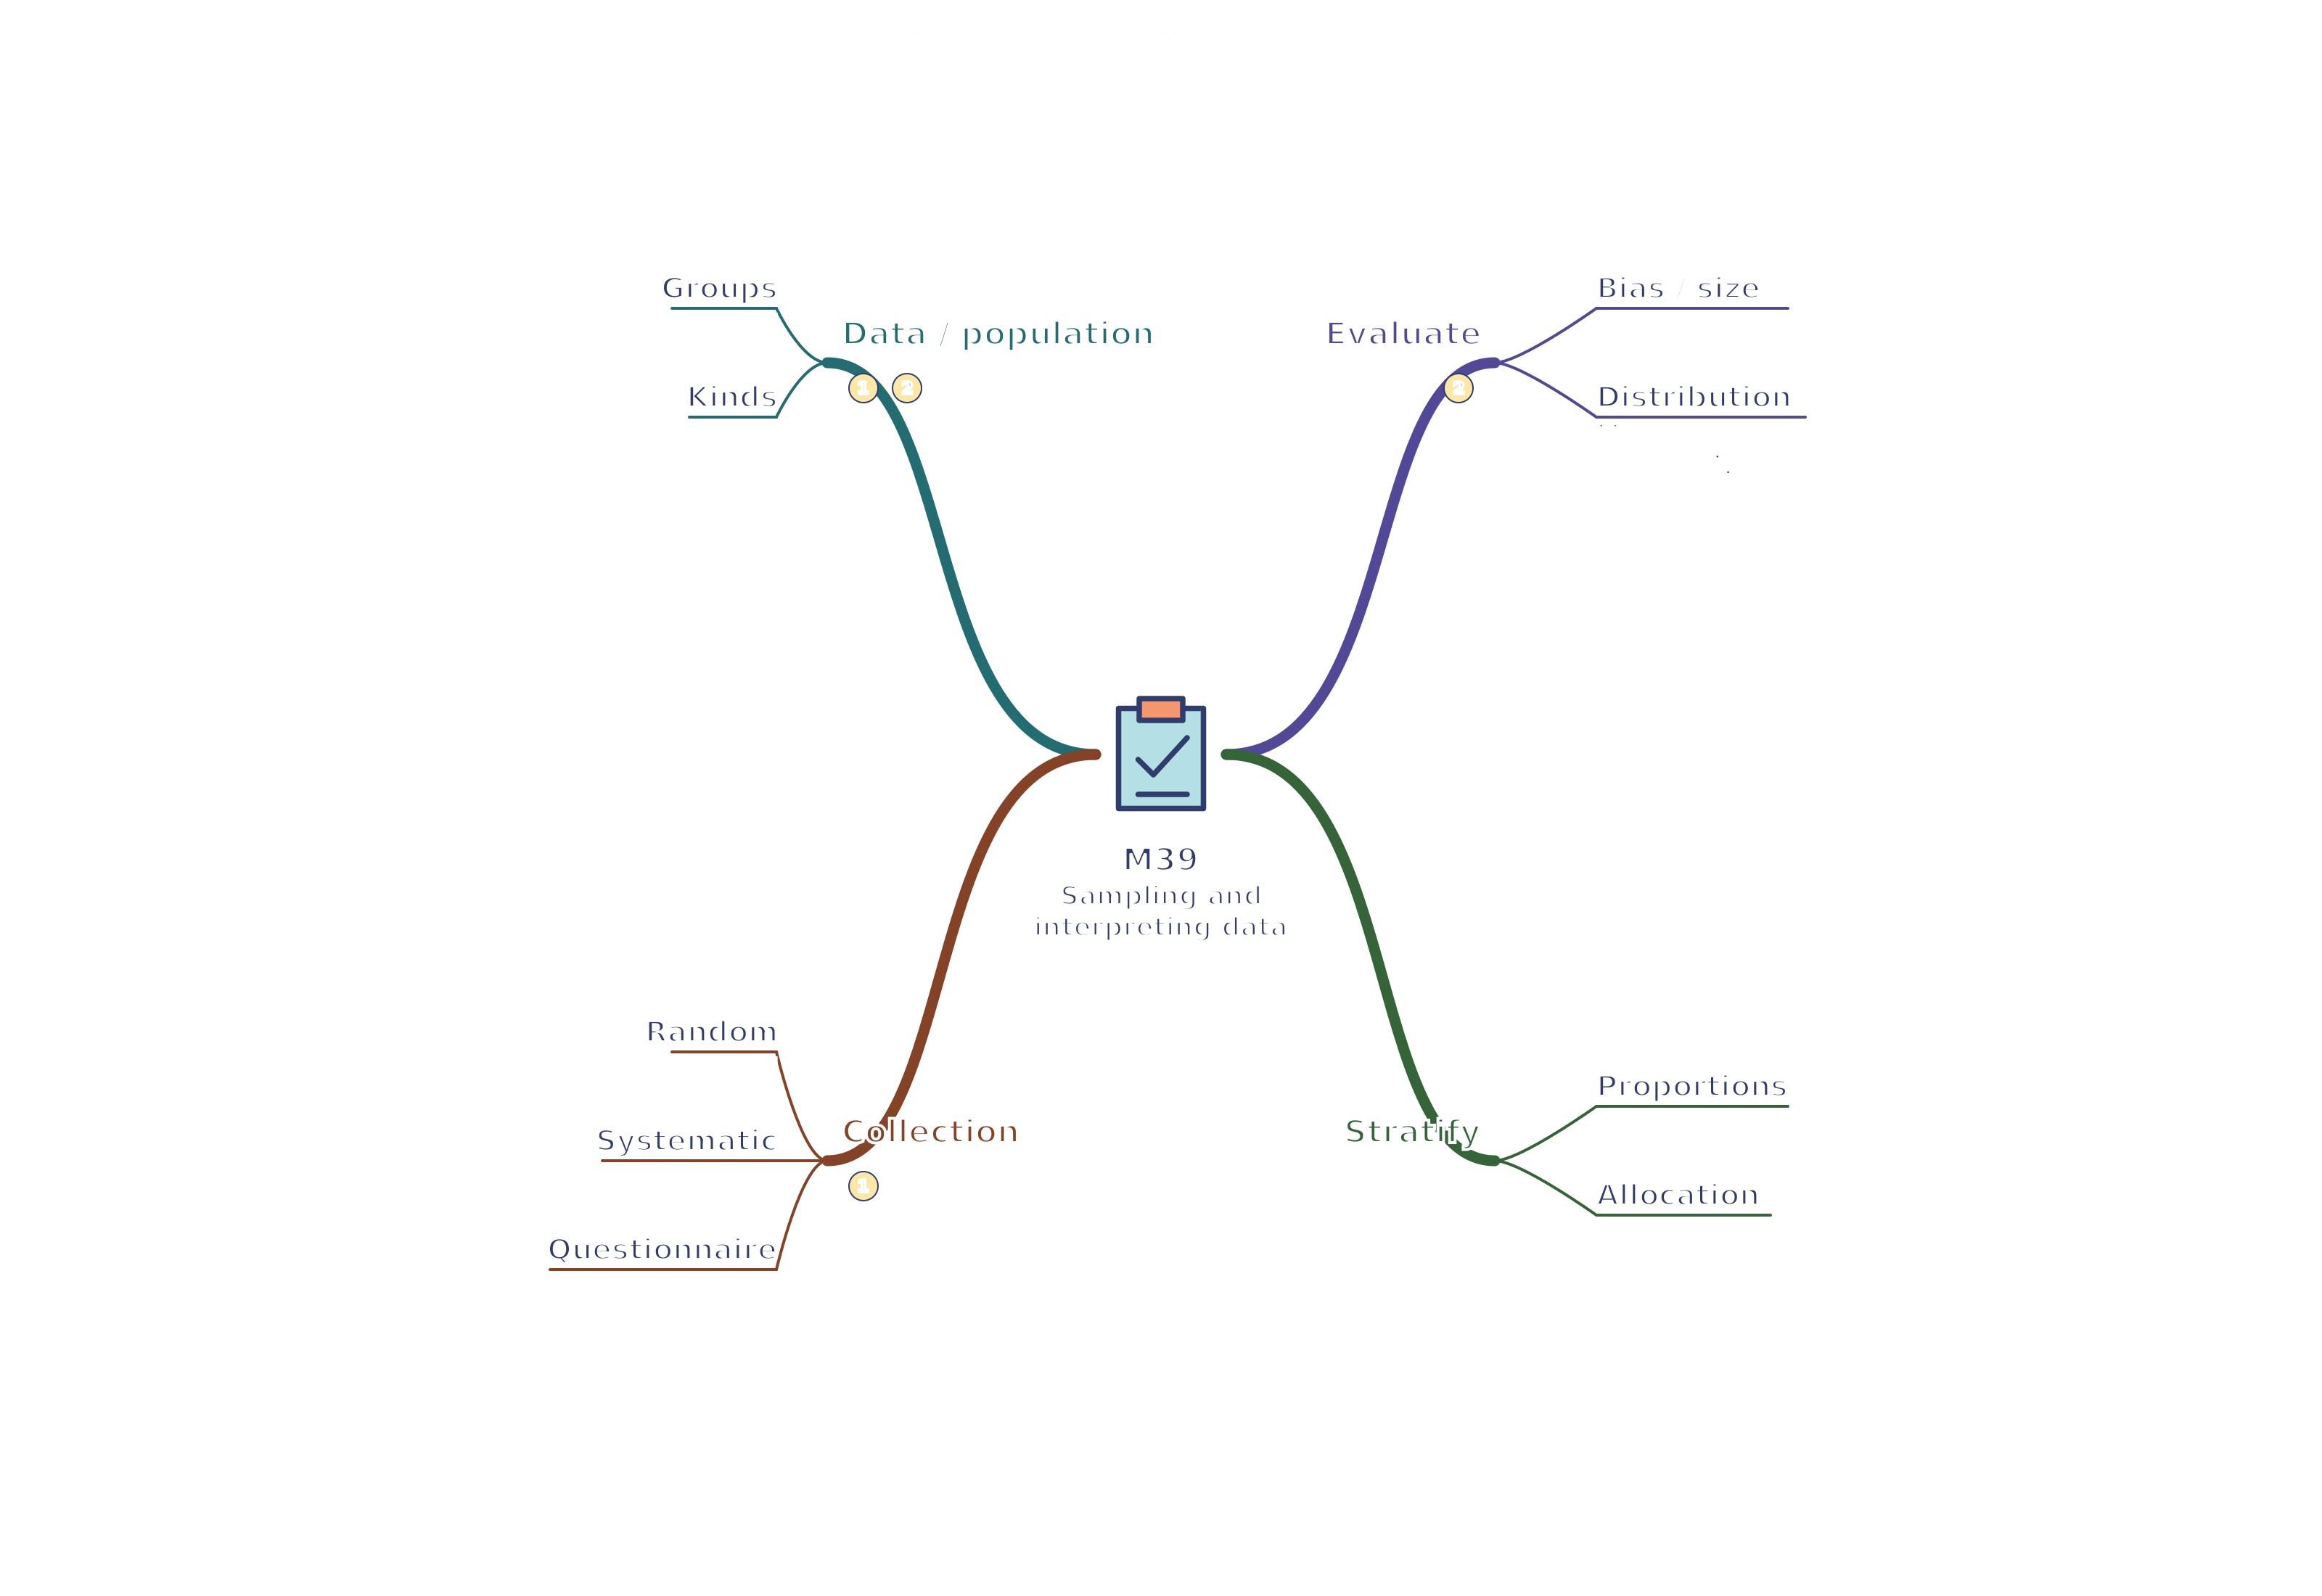
Revision notes, worked examples and methods for sampling and interpreting data.
Notes and quizzes ready · 50 questions · Revision video ready.
Foundation shows shared notes and questions. Higher includes the shared content and labelled Higher extensions. Changing tier starts the notes and a new quiz set.
Revise the key ideas
Populations, samples and data types
A population is the complete group being studied. A sample is a smaller group selected to investigate it. A census measures every member, which can be costly or impractical.
Discrete numerical data are counted, such as numbers of siblings. Continuous numerical data are measured, such as height. Categorical data describe groups, such as a travel method.
A sample should represent the population relevant to the question. Asking only one friendship group about a whole school's preferences risks bias.
Random sampling gives each population member an equal chance in a simple random selection. Use a complete sampling frame and random numbers; avoid duplicate selections if sampling without replacement.
Systematic sampling takes every kth member after a random start. Check that a repeating pattern in the list does not bias the chosen sample.
Questionnaires should use clear wording and non-overlapping response categories that cover possible answers. Avoid leading questions such as “Don't you agree that…?”.
Evaluating evidence
A larger representative sample usually reduces random sampling variation, but size alone cannot remove selection bias. Ten thousand volunteers may still be unrepresentative.
Non-response can bias results if people who respond differ from those who do not. State the population, sample size, method and missing responses when interpreting a survey.
Use statistics to describe distributions rather than claiming every individual has the average value. A mean of 2.4 siblings is possible even though no one has 2.4 siblings.
Compare both a measure of centre and spread, with context. A higher mean journey time and larger range suggest longer journeys on average and more variation.
Higher — proportional stratified sampling
Stratified sampling separates a population into groups, then samples in proportion to each group's size. Randomly select within each group to avoid bias. A proportional stratified sample
Worked example: A school has 120 Year 10 and 180 Year 11 students. For a proportional sample of 50, choose 50 × 120300 = 20 from Year 10 and 30 from Year 11.
For non-integer group allocations, round carefully so the sample total still matches the target. Explain how any remaining places are assigned.
Stratification improves representation of the chosen groups; it does not guarantee every relevant characteristic is represented or that answers are unbiased.
Test yourself
50 questions · Sets of 10 from the selected tier. For fractions, use / when typing; for powers, use superscripts or ^. Follow each question's answer format. These quick checks support revision; practise full written solutions and proofs too.
Watch M39 · Sampling and interpreting data
Revise sampling and interpreting data with this narrated video. Use the player controls to pause, seek, adjust the volume or mute. Turn English captions on or off using the captions menu.
 Mr Kidman's Classroom